The Surprise Factor: Identifying and Leveraging Earnings Surprises
/The "surprise factor" is a commonly used fundamental factor to measure the difference between a company's actual earnings and market expectations. If a company’s earnings exceed market expectations, it often results in earnings surprises, which can drive short-term stock price increases. Interestingly, over a period following the announcement, these companies tend to outperform their peers—this phenomenon is known as the Post-Earnings Announcement Drift (PEAD).
How to Identify Stocks with Positive Earnings Surprises?
There are generally three key approaches:
1. Earnings Exceeding Market Expectations
After an earnings announcement, investors express their views through buy or sell decisions. According to the PEAD theory, stocks of companies that underperform expectations tend to experience prolonged declines, whereas those exceeding expectations are likely to generate sustained positive excess returns in the future. This effect arises mainly due to delayed reactions by investors.
In the A-share market, individual investors often display lagged responses and herd behavior, leading to post-earnings drift even months after the surprise. This asymmetry in information provides an opportunity for capturing considerable excess returns.
2. Historical Data-Based Earnings Surprises
Comparing a company's current financial data with its historical data can also reveal earnings surprises. Stock price movements are influenced by two components: changes in a company’s earnings and changes in its price-to-earnings ratio (P/E). When analyzing financial data, the primary focus is on predicting earnings changes.
For stocks with stable earnings growth, assuming no significant operational changes, linear projections can be used.
For industries or stocks in cyclical upswings, linear projections may underestimate growth, requiring more sophisticated and refined methods.
By comparing projected earnings with reported earnings, stocks with positive surprises can be identified.
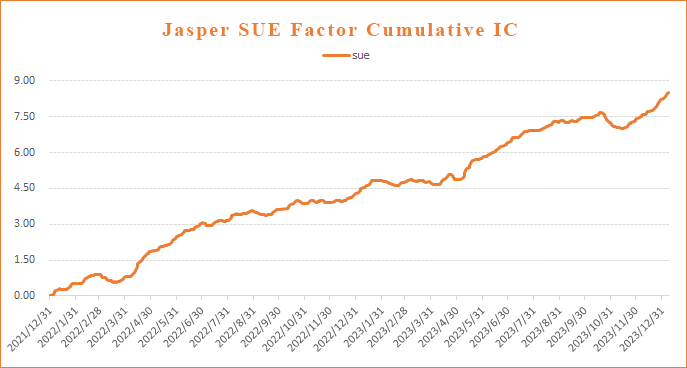
Note: A commonly used surprise factor is SUE (Standardized Unexpected Earnings), representing the deviation between reported earnings and expectations. Generally, the greater the increase, the stronger the stock’s future performance. IC (Information Coefficient) measures the factor's predictive power for returns. Data from Jasper Capital demonstrates SUE's consistent predictive effectiveness in recent years.
3. Earnings Surpassing Analyst Expectations
Due to the inherent delays and low frequency of traditional financial reporting, significant changes in corporate performance are not immediately reflected. Analyst reports can effectively bridge this gap by refining predictions based on historical data.
When corporate earnings change significantly, analysts often highlight terms like "exceeded expectations" in report titles or content. Through text mining, companies with surprises can be quickly identified.
Additionally, revisions in analysts' expectations can also serve as surprise indicators. For instance, if analysts raise earnings forecasts post-announcement, it suggests a positive earnings surprise.
Fine-Tuned Data Processing + Multi-Factor Combination = More Effective Surprise Signals
To ensure robust model performance, Jasper Capital constructs surprise signals from multiple dimensions:
Granular Data Processing:
Analyst expectation data, for instance, excels in forecasting future corporate performance. However, many small- and mid-cap stocks lack analyst coverage, resulting in data gaps. In practice, we use consensus expectation data—leveraging data provider forecasts for uncovered stocks while applying our logic-based predictions to enhance sample completeness.Multi-Factor Integration:
The three dimensions mentioned earlier focus on identifying earnings surprises from a fundamental perspective, complementing each other. In addition, we incorporate price-volume signals—analyzing stock price and trading volume changes before and after announcements. The combination of fundamentals and price-volume data helps better capture market expectations and identify companies with surprises.
Thanks to Jasper Capital's in-depth research on fundamental and price-volume aspects, the surprise signals constructed on this basis deliver consistent and stable excess returns. The synergy of data, factors, and models enables uncovering hidden “giants” in the market and capturing earnings surprises.


